Application structure
Welcome page
The Welcome Page offers a streamlined interface for quick access to the key areas of our application.
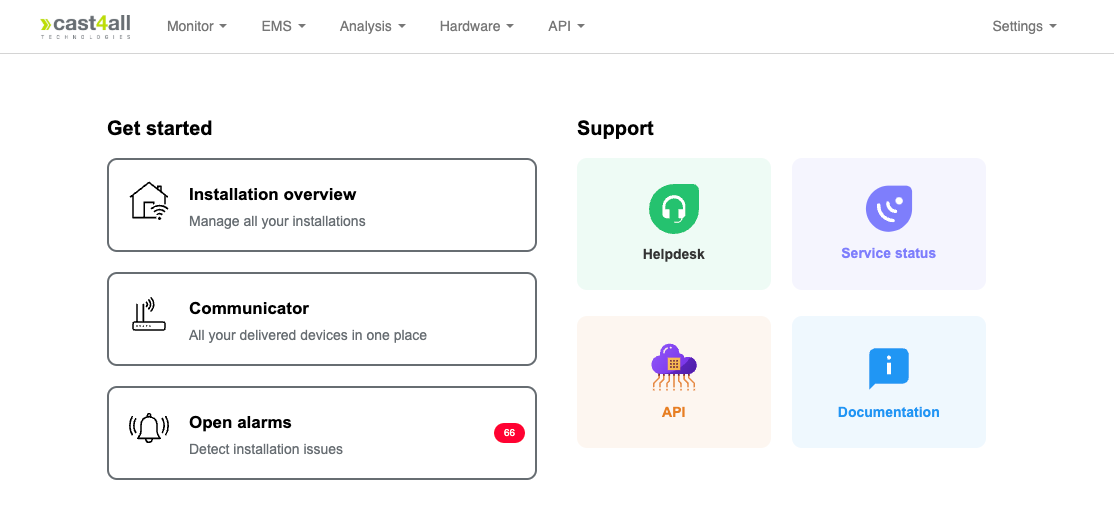
Get started buttons
- Installation Overview: Access to all your installations.
- Communicator: Navigate to the hardware page for information about both installed and pending hardware components.
- Open Alarms: View the number of active alarms and quickly access the alarms page for detailed status and resolution.
Support buttons
- Helpdesk: Submit questions or report issues through our helpdesk ticketing system.
- Service Status: Check real-time information on network connectivity and system status.
- API Documentation: Explore comprehensive API references and usage examples.
- Documentation: Return to this website for further guidance.
Navigation bar
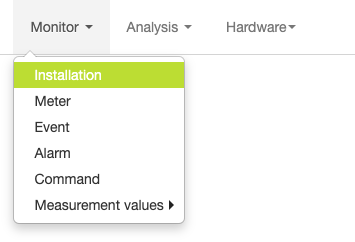
Located at the top of the page, the navigation bar is your primary tool for accessing different sections of the application. Each section includes a dropdown menu for efficient navigation.
Typically, the Monitor section is the most widely used section where details about components such as Installation, Meter, Alarm, Event, etc. are located.
Toolbar

Each page includes a toolbar with action buttons for interacting with data.
| Button | Description |
|---|---|
 |
Create new instance |
 |
View details, Edit instance, Delete instance |
 |
Open finders |
| Use this button to reload the contents of a page/table instead of refreshing the entire web page | |
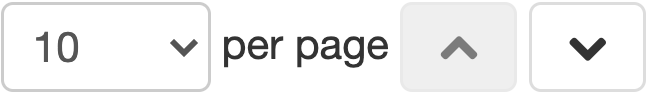 |
Items per page, previous page, next page |
Finders
A search bar is available on each page to find records by a predefined field or combination of fields. Clicking the search icon will display a list of all available search options.
%) to search for a partial match.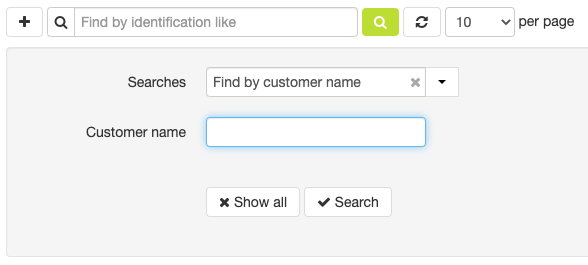
Waterfall screens
Our platform provides detailed monitoring and device data about your installations, organized in a hierarchical 'waterfall' structure.
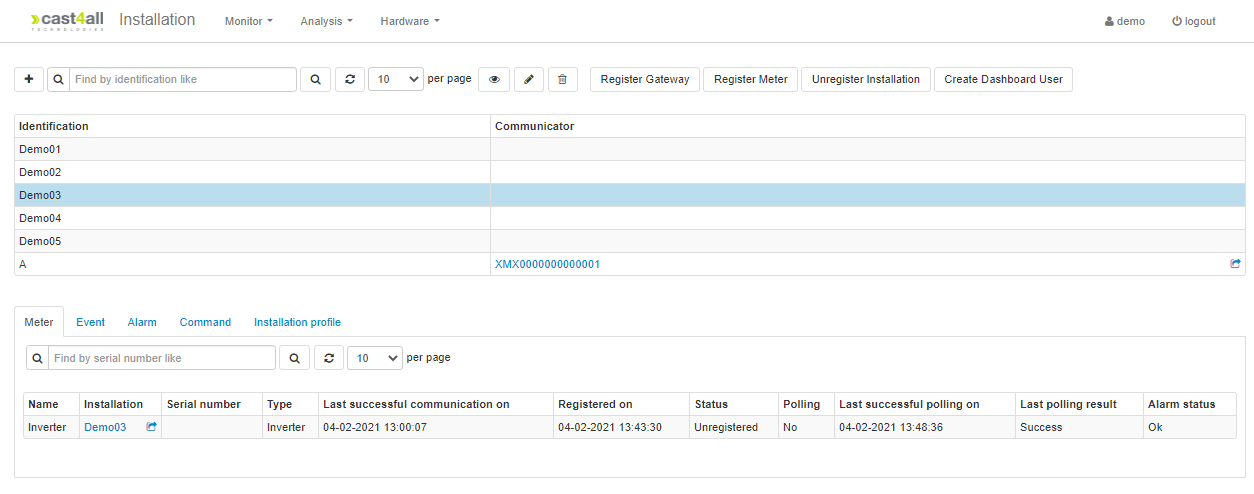
How It Works
- Select a component from the navigation bar dropdown menu.
- A list of records for that component appears at the top of the screen.
- Selecting a record reveals related components below in cascading levels.
Examples
- Example 1: Page "Installation" can cascade as follows: Installation -> Meter -> Measurement -> Measurement Value.
- Example 2: Page "Installation" can cascade as follows: Installation -> Alarm